Print Analytics & Reporting Software
Stop guessing which jobs are profitable and which machines are underperforming. Get real-time dashboards, production KPIs, and financial reports that turn your Print MIS/ERP data into decisions — with zero manual spreadsheet work.
Running a Print Shop Without Real Data Means Decisions Based on Guesswork.
Manual, Error-Prone Process
- Job profitability figures pulled from spreadsheets at month end — too late to act
- No visibility into which machines are underperforming or idle during production
- Customer revenue data scattered across invoicing, CRM, and email threads
- Reports built manually by copying data between systems — hours per week
- Pricing decisions made on gut feel because actual job costs aren't tracked
Automated, Efficient Process
- Real-time dashboards show job profitability, machine status, and revenue as it happens
- Production floor analytics identify bottlenecks before they delay delivery
- Customer revenue, reorder frequency, and lifetime value visible in one screen
- Scheduled reports land in your inbox daily, weekly, or monthly — zero manual work
- Actual vs. estimated cost per job tracked automatically so you price with confidence
Know Your Numbers, Grow Your Margins
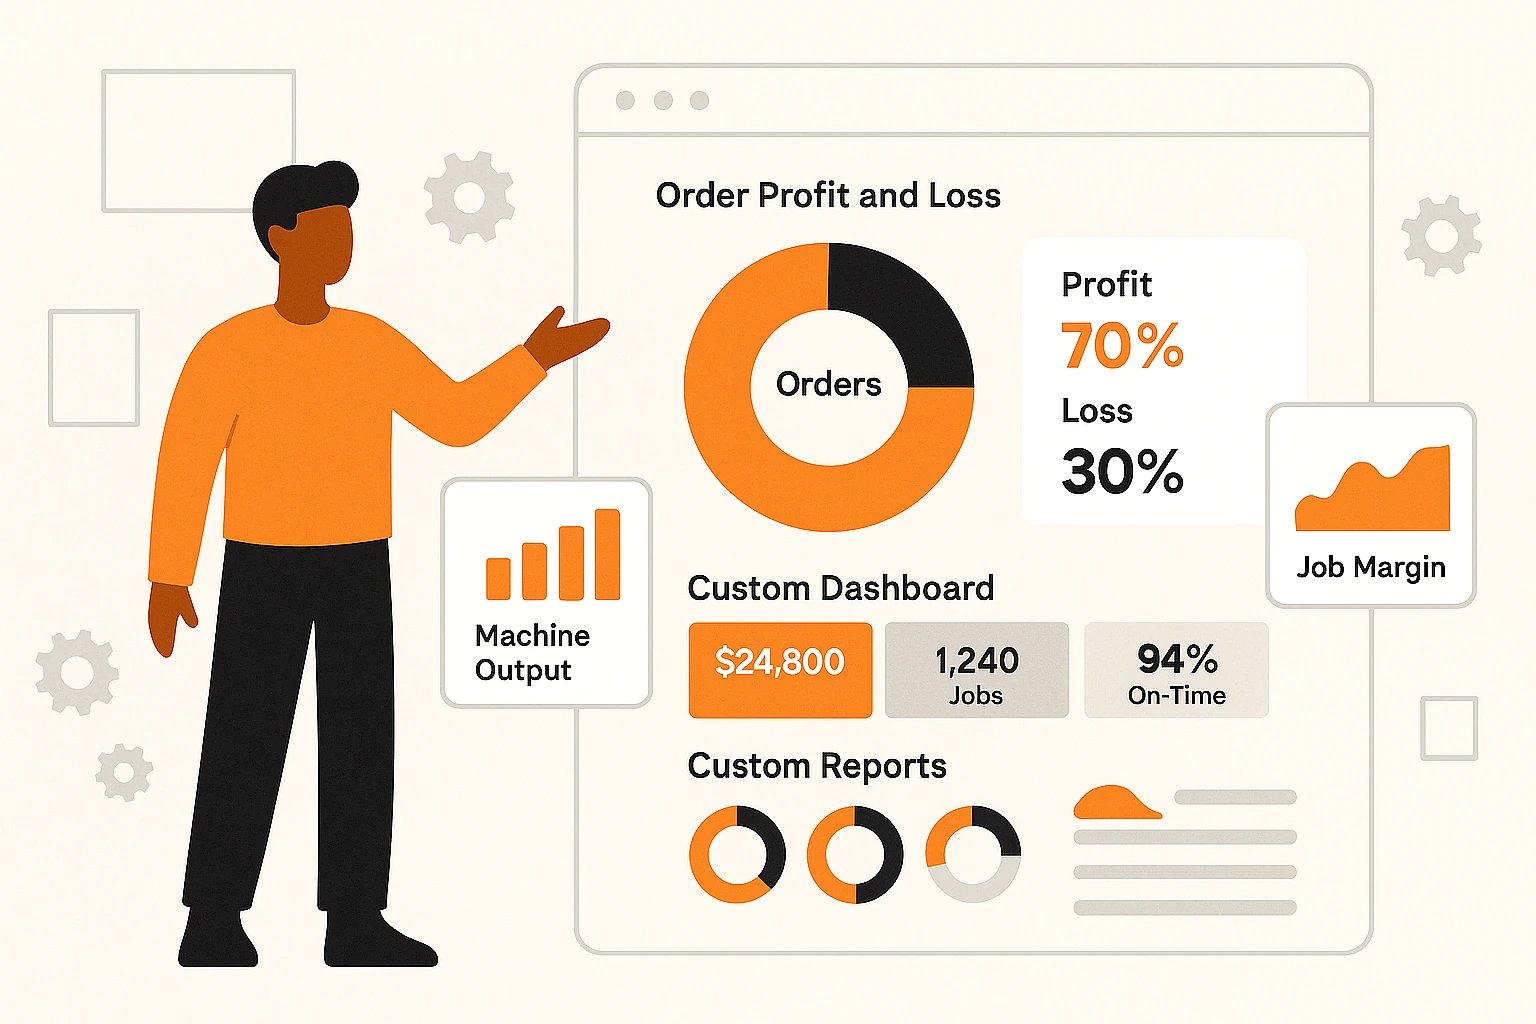
Real-Time Dashboards
Live visual dashboards showing revenue, jobs in progress, machine status, and production throughput. No more waiting for end-of-month reports to spot problems.
Job Profitability Analysis
See actual vs. estimated costs per job — materials, labour, machine time, and overhead. Identify which products and customers drive margin and which drain it.
Production KPI Tracking
Track turnaround times, on-time delivery rates, waste percentages, and machine utilisation across your entire floor. Benchmark against your own historical data.
Every Metric, Visible at a Glance

Executive Overview Dashboard
A single screen showing everything an owner or manager needs: total revenue, average job margin, orders this week, top customers, and pipeline value. Drill down into any metric to see the underlying jobs.
- Revenue and margin trends — daily, weekly, monthly
- Top 10 customers by revenue and profitability
- Job volume by product type and decoration method
- Pipeline value — quotes pending vs. confirmed orders
- Configurable date ranges with comparison periods
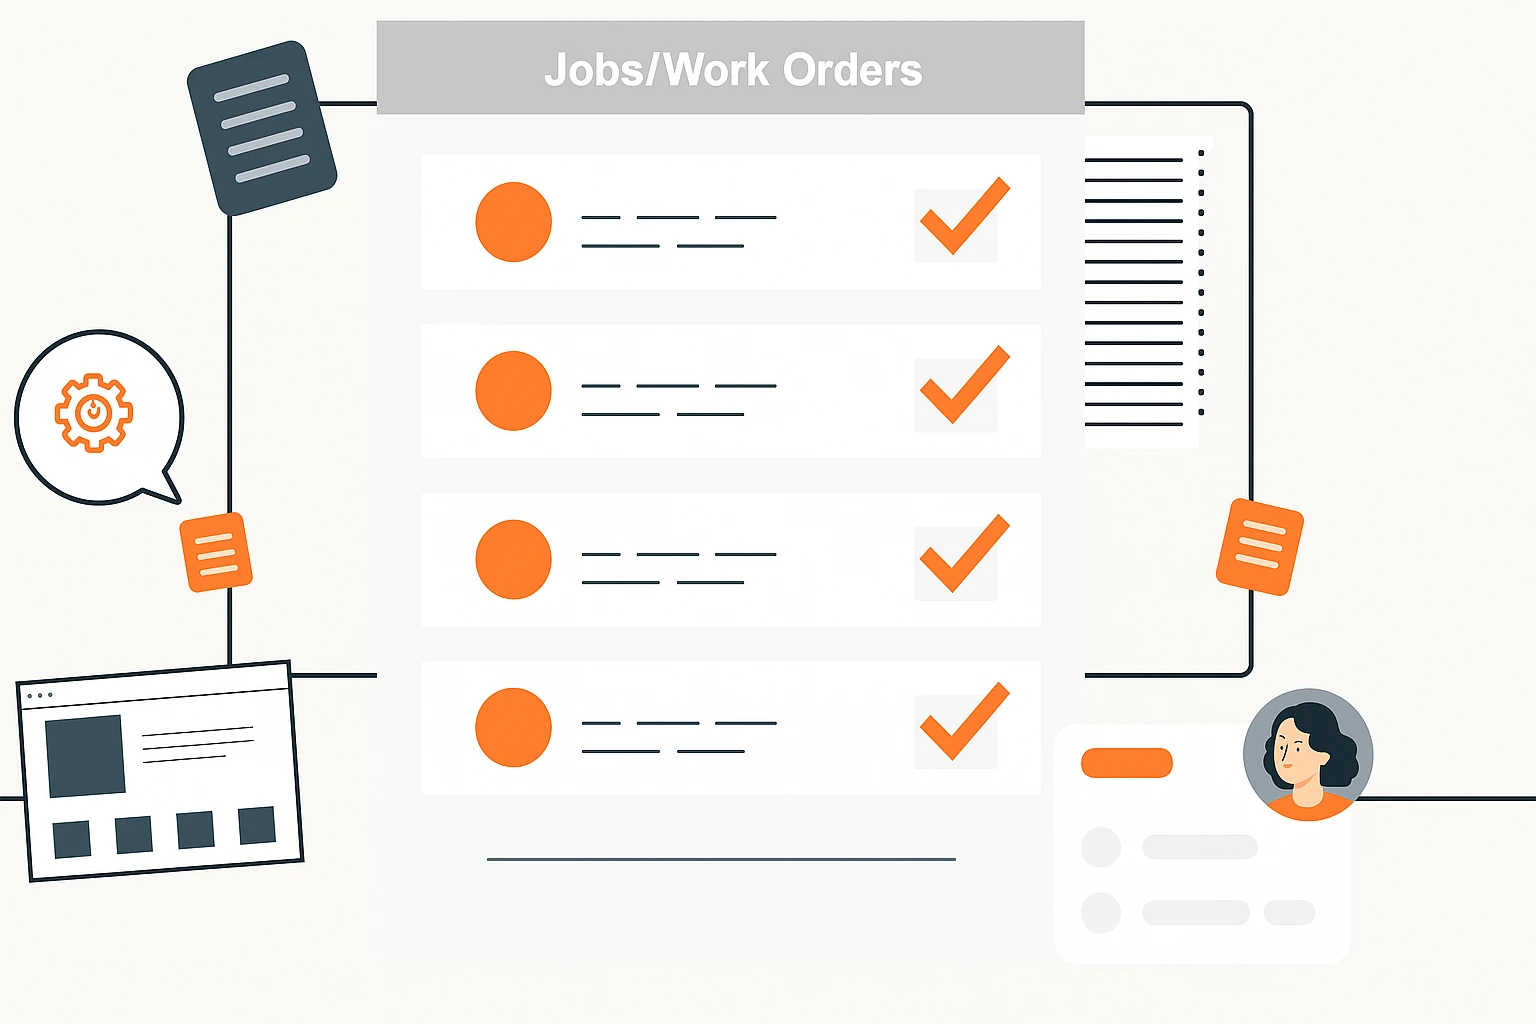
Production Floor Analytics
Monitor every machine and workstation in real time. See which machines are running, idle, or in maintenance. Identify bottlenecks before they cause delivery delays and rebalance workloads on the fly.
- Machine utilisation percentage with uptime/downtime split
- Jobs queued per workstation with estimated completion
- Bottleneck alerts when queue depth exceeds thresholds
- Waste and spoilage tracking by machine and operator
- Shift comparison — output per shift across all stations

Custom Report Builder
Build any report you need without IT. Drag data fields, apply filters by date, customer, product, or machine, and save templates for one-click generation. Schedule reports to land in inboxes automatically.
- Drag-and-drop field selection from all MIS data
- Multi-filter: date range, customer, product, machine, operator
- Saved report templates for repeated use
- Scheduled email delivery — daily, weekly, monthly
- Export to PDF, Excel, and CSV
From Raw Data to Practical Insights in Four Steps
Data Captured
Dashboards Update
Alerts & Reports
Decide & Act
See Your Print Shop Data Come Alive
Book a personalized demo and see how real-time analytics dashboards turn your MIS data into margin-boosting decisions.